Saved on this device only.
Interactive maps
Maps
Our doctor maps show where doctors practice, what they prescribe and how much drug companies pay them, for every state and county. Each map uses public federal data. It works on phones, and you can switch to a table or download the numbers.
What the doctor maps show
- Doctors per capita: physicians and other clinicians per 100,000 residents, for more than 100 specialties.
- Prescribing: Medicare prescriptions per 1,000 residents aged 65 and over, for single drugs and drug groups.
- Industry payments: money that drug and device companies paid clinicians, per resident.
- Doctor age and shortages: where physicians are near retirement, and where residents live in federal shortage areas.
- Disability: how many people have each type of disability, and how many matching specialists serve them.
How to read the doctor maps
First, choose a specialty, drug or measure in the menu. Then pick counties or states, and a rate or a total. Darker areas have more. Hatched areas have none, or no data. For example, a rural county with no psychiatrist shows hatching on the psychiatry map.
Select a state to zoom in and compare its counties. Select a county to see its rank, its population and how it compares with the state and the country. In addition, every map has a table view, a CSV download, a saved image and a share link.
Where the numbers come from
Clinician counts come from the CMS NPI Registry (opens in a new tab), placed by practice address. Populations come from the Census Bureau’s American Community Survey (opens in a new tab). Prescribing and payment data come from Medicare Part D and CMS Open Payments. Because every map uses the same counts, a number on one page matches the same number everywhere else on the site. Our methodology explains each step.
Related: doctors per capita by county, psychiatrist shortage by county, GLP-1 prescriptions by state.
Questions about the doctor maps
Can I use the doctor maps in a report or article? Yes. Each map has a Save image button that stamps the source and link on the picture. You can also download the numbers as a CSV file. Please credit contact.doctor and the original government source.
Why does my county show no doctors of a specialty? We place each clinician at the practice address in the NPI Registry. So a county can have no listed specialist even if one visits part-time. In that case, check the nearby counties on the map.
-
Disability in America: How Many Specialists Serve People with Each Type of Disability
One in seven Americans has a disability, and one in three people over 65. A county map by type and age, and how many matching specialists serve each group, state by state.
-
Doctor Shortage Areas: Where Americans Lack Primary Care, Dental and Mental Health Care
Millions of Americans live in federally designated shortage areas for primary care, dental or mental health care. A county map, what designation means, and why it matters.
-
Your First Job After Residency: How to Evaluate an Offer and a Location
How to compare locations and offers for your first attending job: local demand, shortage-area incentives, practice types, RVU targets and contract terms.
-
Residency Interview Questions to Ask, and How to Research a Program First
The questions to ask program directors and residents, the questions they will ask you, and the public data to check before interview day.
-
How to Choose a Residency Program Using Public Data
Program websites and interview days show a program at its best. Public data shows patient volume, hospital quality, local demand and where graduates practice.
-
How to Negotiate an RVU-Based Physician Contract
A step-by-step guide to the parts of an RVU-based physician contract you can negotiate, the questions to ask, and how to sanity-check productivity targets with public data.
-
Work RVUs by Specialty: Medicare wRVU Data for Every Specialty and State
How many Medicare work RVUs does a typical clinician generate in each specialty? Median, middle half and top 10% for 86 specialties, state maps and the codes behind them.
-
Which Doctors Offer Telehealth? Medicare Data by Specialty
About 1 in 5 Medicare clinicians offer telehealth; endocrinology and oncology lead.
-
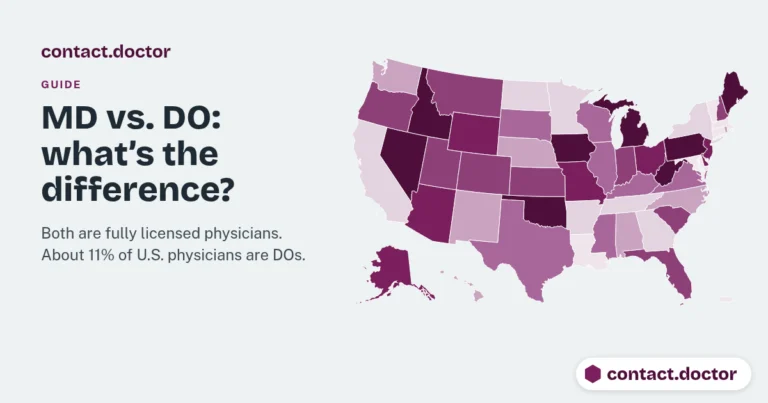
MD vs. DO: What’s the Difference?
MDs and DOs are both fully licensed physicians. About 11% of U.S. physicians are DOs.
-
Women in Medicine: Which Specialties Have the Most Women Doctors
About 39% of U.S. physicians are women, but the share ranges widely by specialty.
-
Clinicians per capita
Nurse Practitioners, PAs and Other Clinicians per Capita by County
Maps of nurse practitioners, physician assistants, dentists, pharmacists, physical therapists and psychologists per 100,000 residents in every state and county.
Jump to: Nurse practitioners Physician assistants Dentists Psychologists
-
Doctors per capita
Psychiatrist Shortage by County: Half of U.S. Counties Have No Psychiatrist
1,611 U.S. counties, home to 26.3 million people, have no psychiatrist. Psychiatric nurse practitioners now outnumber psychiatrists. Map by county and state.
Jump to: Psychiatry Child psychiatry By state
-
Clinicians per physician
Nurse Practitioners per Physician by State and County: Where NPs Outnumber Doctors
There are 43 nurse practitioners for every 100 U.S. physicians, and in 1,059 counties NPs outnumber physicians. Map by state and county.
Jump to: Nurse practitioners NPs by county Physician assistants
-
Aging doctors
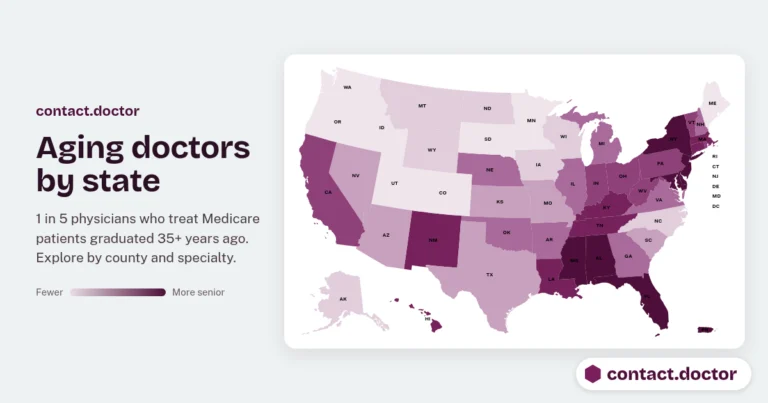
Aging Doctors by State and County: Where 1 in 5 Physicians Graduated 35+ Years Ago
One in five U.S. physicians who treat Medicare patients graduated from medical school at least 35 years ago. See where the workforce is most senior, by state, county and specialty.
Jump to: All physicians Cardiology Psychiatry Primary care
-
Industry payments
Drug and Device Company Payments to Doctors by State and County: 2025 Open Payments Map
Drug and device makers paid $2.10 billion to about 1 million U.S. clinicians in 2025. See payments by state, county, company, drug and payment type.
Jump to: All payments Meals GLP-1 drugs AbbVie
-
Medicare prescribing
GLP-1 Prescriptions by State and County: Ozempic, Mounjaro and 13 More Medicare Drug Maps
Medicare covered 19.4 million GLP-1 prescriptions in 2024. Louisiana prescribes Ozempic-type drugs at nearly twice the national rate. Explore GLP-1s and 13 more drug groups by state and county.
Jump to: GLP-1 drugs Opioid painkillers ADHD stimulants Antibiotics
-
Doctors per capita
Doctors per Capita by County: Interactive Map of Every U.S. Specialty
An interactive map of doctors per capita by county and state for the whole U.S. Choose any physician specialty to see where care is plentiful and where entire counties have none.
Jump to: All physicians Psychiatry OB-GYN Primary care